Newsletter
Join the Community
Subscribe to our newsletter for the latest news and updates
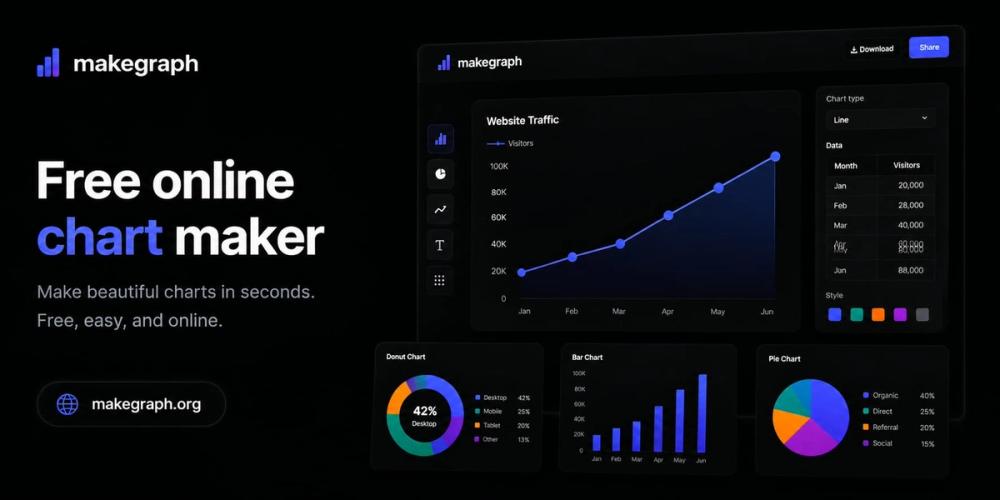
Turn your Excel or CSV data into clear charts in 1 minute. Free online chart maker.

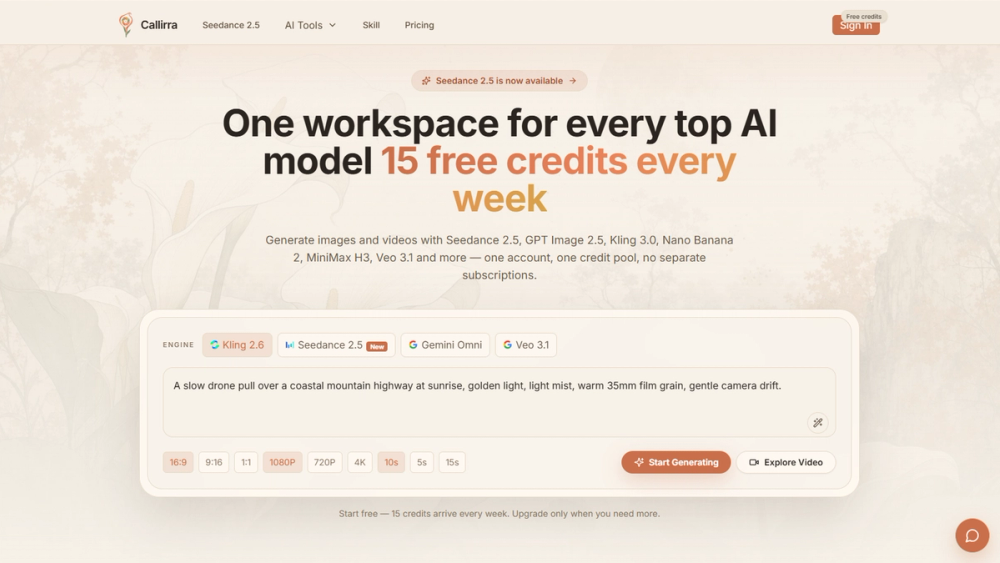
See how AI image prompts combine example images, full prompt text, model filters, categories, favorites, and optional on-site generation.

Free online tools that run 100% in your browser - word counter, JSON formatter and more by F9XR Team. No sign-up, zero data retention.
MakeGraph is a lightweight online chart creation tool designed for people who need charts quickly.
Instead of learning complex visualization software or configuring dozens of chart settings, users can simply import data, make quick edits, and instantly generate clear, presentation-ready charts.
The goal is simple:
Turn data into usable charts in minutes.
Most charting tools fall into two categories:
Many business intelligence and analytics platforms offer powerful capabilities but require significant learning time.
Design tools provide extensive customization options, but users often spend more time adjusting styles than communicating insights.
For most people, neither is ideal.
When someone needs a chart for a report, presentation, article, classroom assignment, or meeting, they usually want one thing:
Get a clear chart and move on.
MakeGraph is built for that exact scenario.
Anyone who has data and needs a chart without becoming a chart expert.
Create charts for weekly, monthly, or quarterly reports.
Generate presentation-ready visuals for slides and meetings.
Create charts for blog posts, newsletters, and social media content.
Update numbers during discussions and immediately export new charts.
Upload data and generate charts in the shortest possible workflow.
No tutorials, manuals, or training required.
Charts follow a unified visual style to ensure readability and professionalism.
Focus on communicating information instead of spending time on design settings.
Upload a spreadsheet or paste data directly.
Quickly modify rows, columns, and individual cells.
MakeGraph automatically suggests the most appropriate chart type.
Download high-quality images or share charts online.
Different data tells different stories.
MakeGraph automatically recommends chart types based on data structure:
| Data Type | Recommended Chart |
|---|---|
| Category comparison | Bar Chart |
| Time series | Line Chart |
| Trend over time | Area Chart |
| Part-to-whole | Pie Chart |
| Distribution and relationships | Scatter Plot |
Users always understand why a chart is recommended.
Additional chart types may be introduced over time while maintaining the product's simplicity.
Charts can be used in multiple ways:
This allows charts to move beyond screenshots and become reusable content.
Everyone can:
without feature restrictions.
Premium users simply remove advertisements.
The philosophy is:
Features are not paywalled. Experience is.
Success is not measured by how many features we add.
Success is measured by whether users can create useful charts faster.
If someone can arrive with raw data and leave with a chart in just a few minutes, MakeGraph has done its job.